 Photo by Launde Morel on Unsplash
How do you keep track of your organization’s email deliverability? Do you know where your email program stands in terms of open rate, click rate, spam rate, and other important deliverability metrics?
Deliverability is your email arriving in the inbox of the recipient as intended (not the spam folder), and it’s extremely important to understand and track your email deliverability over time. Our new Deliverability Dashboard makes it easier than ever for you to keep tabs on your organization’s deliverability stats over time.
“Improving your email deliverability isn’t just something that ‘would be nice to do’. Good email deliverability is critical to your mission.”
— Action Network’s Deliverability Guide
The Deliverability Dashboard is a new feature found at the top of the Email tab on your Group Manage Page.
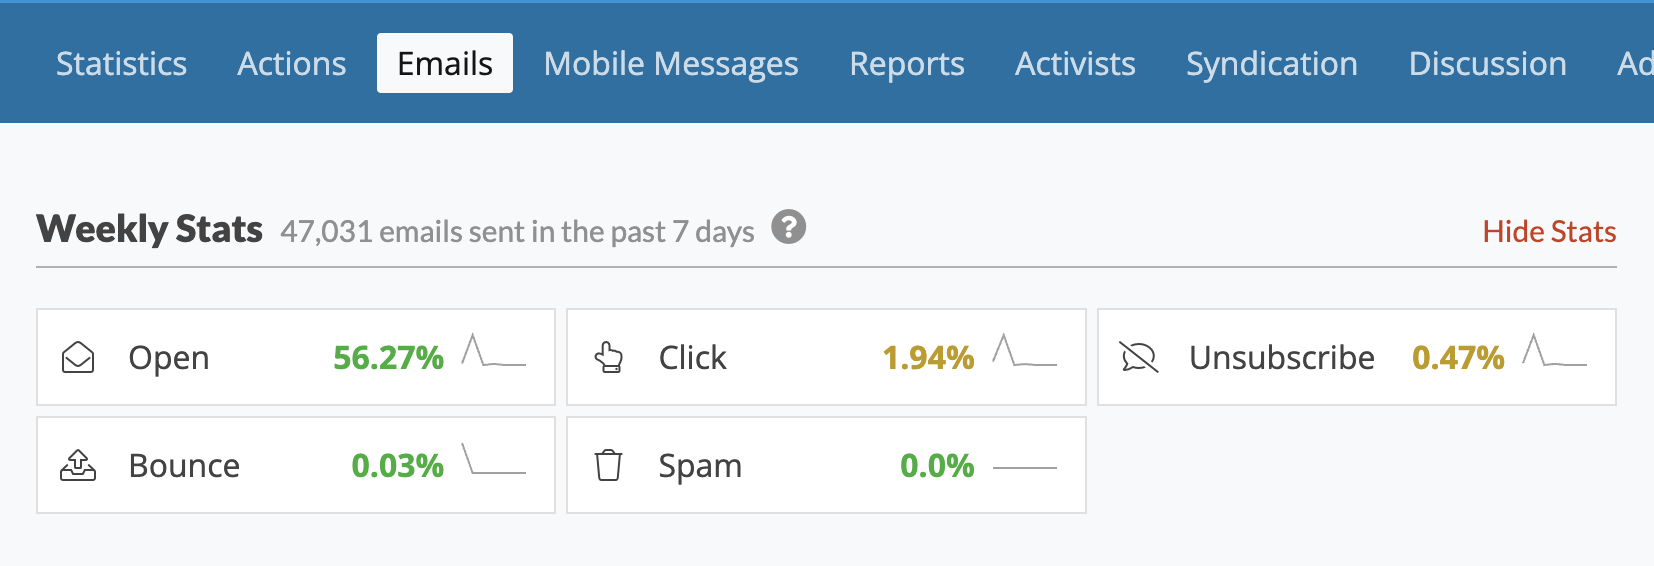
We created this dashboard to give you a snapshot of your email program’s deliverability over the last 7 days. If a stat appears in green, you’re doing excellent by that metric. If it appears in yellow, that metric is at an average performance level. And a consistently red stat indicates you may want to update your deliverability practices.
A couple important notes:
- To dive into email performance of specific sends or periods of time, download your email stats at the bottom of the emails tab.
- These color ratings are suggestions, as every group’s list behaves differently.
- It’s normal for these metrics to fluctuate. For example, some metrics may dip into the red from time to time and shouldn’t be cause for concern. Over time, you’ll be able to see what your list’s baseline is.
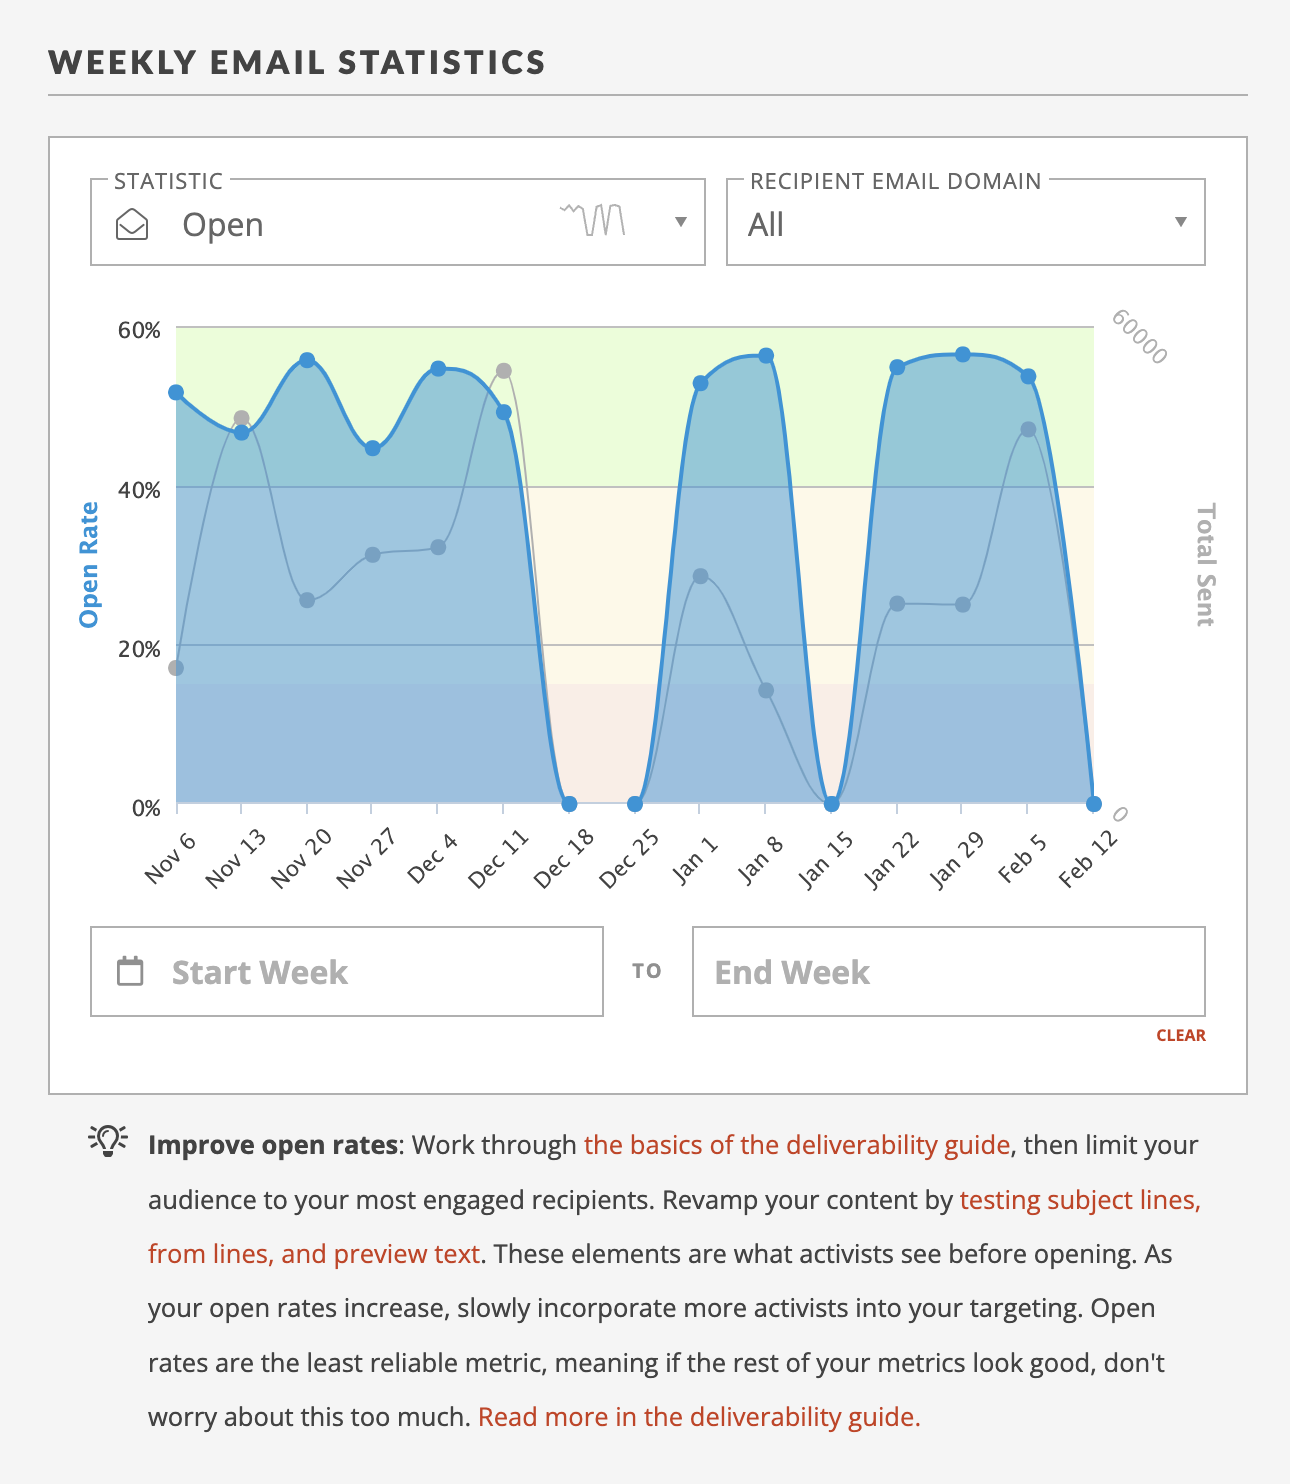
You can click on a metric to see more details about that metric, toggle the date range, and sort results by email domain, such as Gmail, Yahoo, or Outlook.
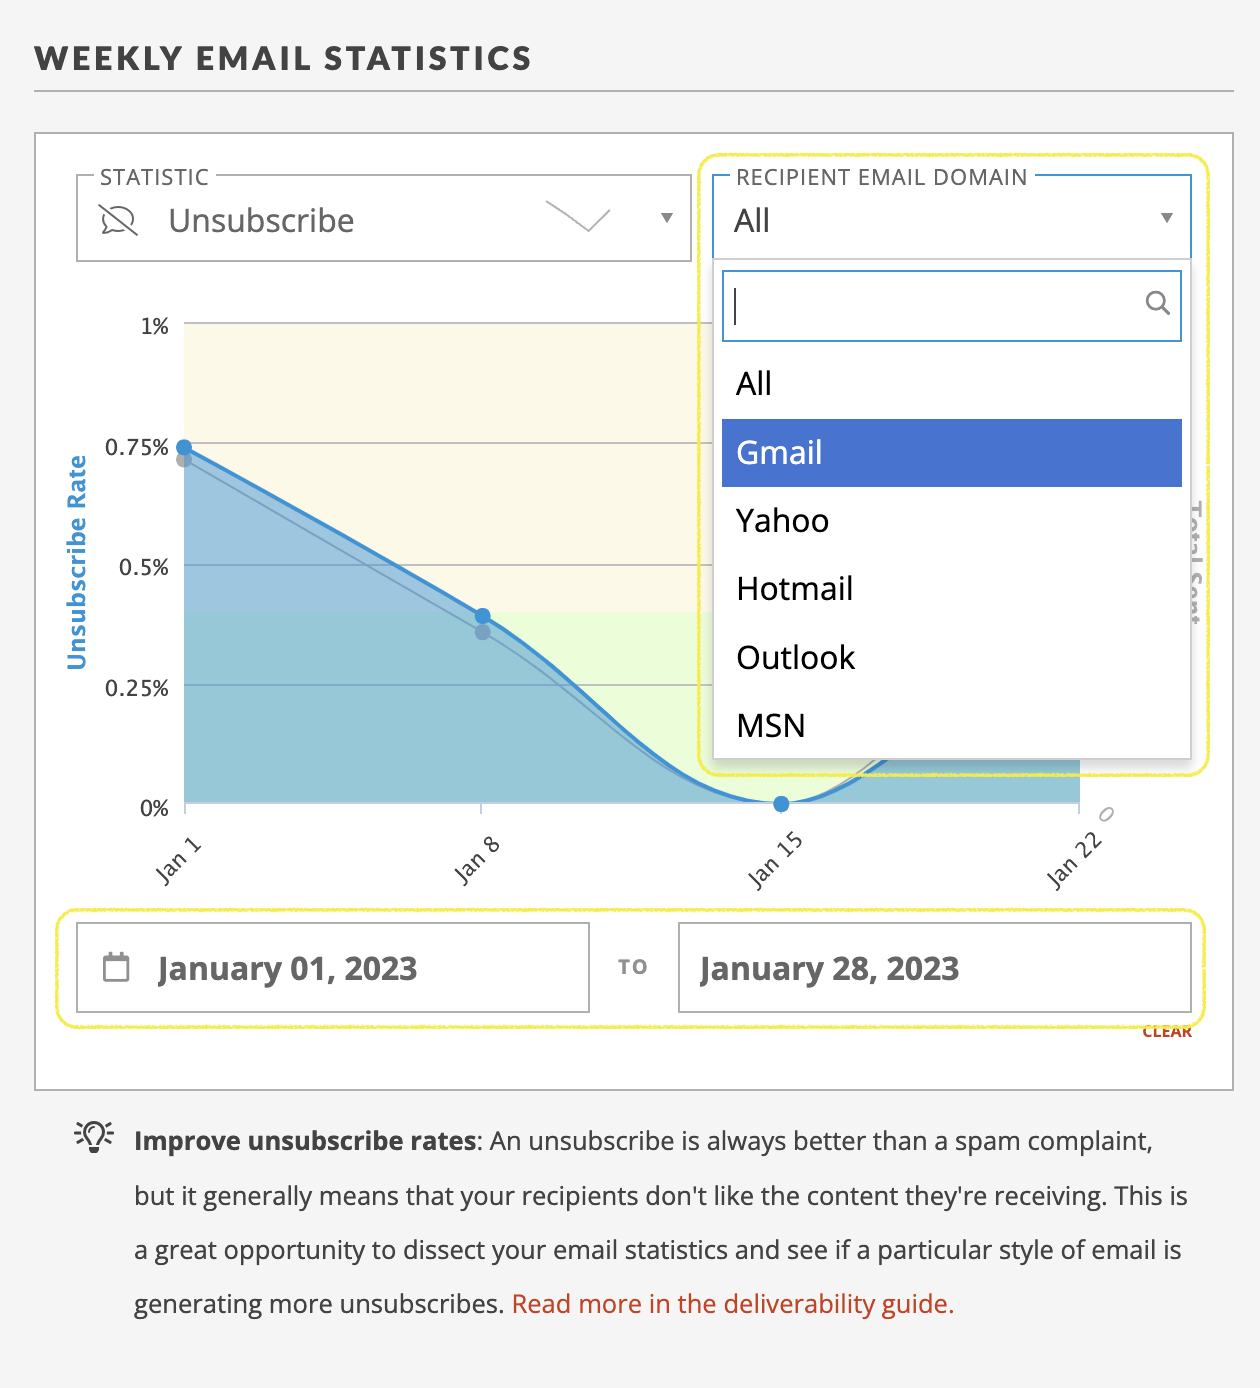
What if some of your stats start to dip into the red? Want to try to improve from yellow to green? Have you identified a specific recipient email domain that seems to perform differently from the others?
You can find answers to all of these questions in our Deliverability Guide! This guide will discuss what deliverability is and how it works as well as strategies to improve (or maintain) your deliverability. Click here to check out the guide!
Did you know that we host live, virtual trainings every week as a part of our monthly training series? Click here to check out the calendar of upcoming trainings and events, including our 103 — Email training!